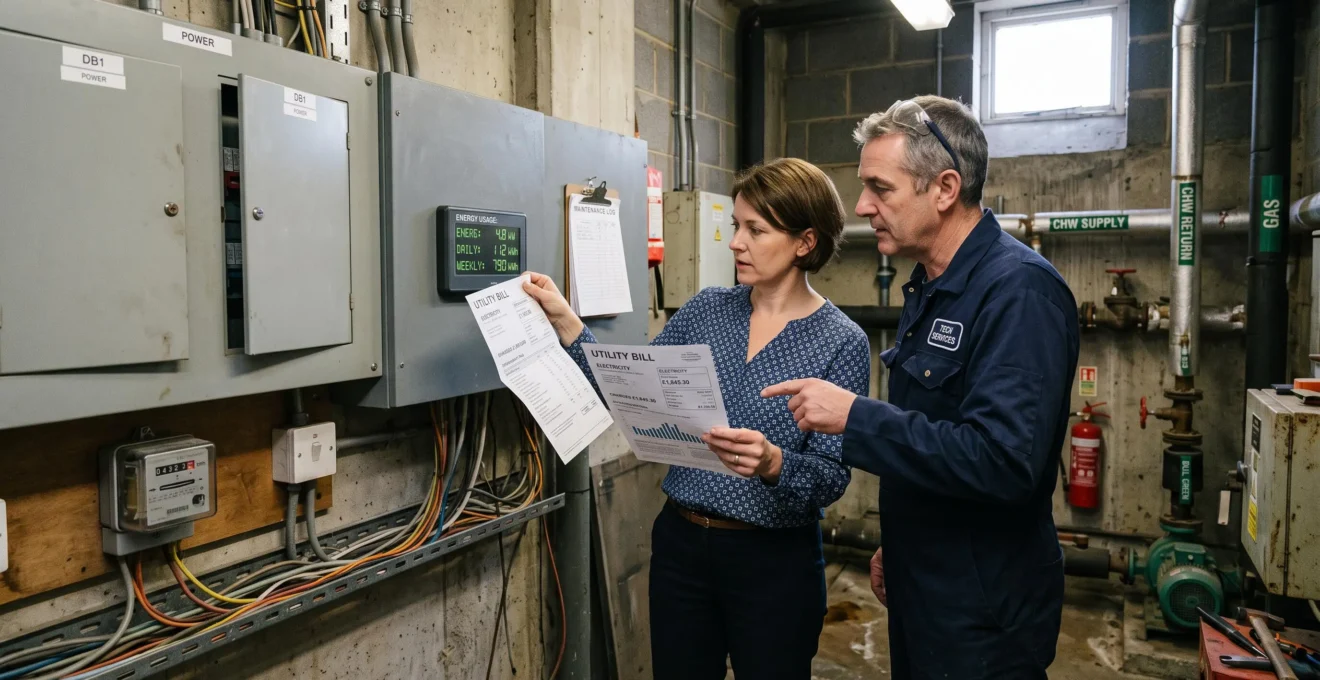
Energy management services can pay for themselves within 90 days when they identify avoidable consumption quickly, translate findings into operational changes and produce verified savings greater than their total fees and implementation costs. But a short payback is a commercial target, not an automatic result of installing monitoring software or hiring a consultant.
For a small business facing unpredictable electricity bills, the first question is not which provider has the most sophisticated dashboard. It is whether enough controllable waste exists to justify paying someone to find and remove it. A 20-person office with unnecessary overnight heating may have a very different opportunity from a workshop already operating near its practical efficiency limits.
The same principle applies to households, although the economics differ: monitoring must lead to savings that exceed its cost and the effort required. For SMEs, a credible service should establish a baseline, implement measurable changes and report financial results against agreed costs. Within one quarter, the owner should be able to judge whether the service is delivering value, even if full payback requires longer.
Energy management ROI: what matters before you pay
- Find the waste first: use existing bills and interval-meter data to identify avoidable consumption before signing a service contract.
- Measure financial payback: compare weather- and activity-adjusted savings with cumulative service fees, installation costs and implementation expenses.
- Buy accountability: demand data ownership, a documented baseline, specific corrective actions and an exit route if the provider cannot demonstrate value.
- Why Do Most Small Businesses Waste 10–25% of Electricity Without Noticing?
- How to Choose an Energy Management Service Using a 12-Point Contract Checklist?
- Which Is Better for a 20-Person Office: Managed Energy Service or DIY Software Dashboards?
- The Reporting Trap That Makes Energy Management Look Successful With £0 Saved
- When Should You Start Energy Management So Your Baseline Data Isn’t Ruined by Seasonality?
- How to Measure Building Efficiency Gains Using Weather Normalisation and 2 Simple Meters?
- Which Should You Choose: Clamp Monitor, Smart Plugs, or Smart Meter Data for a Busy Household?
- How Can You Prove Your Building’s Efficiency Improved After Works Without Expensive Sensors?
Why Do Most Small Businesses Waste 10–25% of Electricity Without Noticing?
Small businesses can overlook substantial electricity waste because energy bills rarely reveal which equipment is responsible, when unnecessary consumption occurs or what it costs. However, the frequently suggested 10–25 % waste range is not a verified average for all SMEs. The useful question is how much avoidable consumption exists at a particular site and whether removing it is financially worthwhile.
Three structural information gaps make waste difficult to detect. First, a flat unit-price tariff gives little incentive to investigate hourly usage patterns: the bill shows what was consumed, not whether consumption was necessary. Second, monthly or less frequent billing delays feedback until the operating decisions behind the costs are forgotten. Third, tenants whose energy is included in service charges may have no direct access to their own consumption data.
These problems are especially relevant in small organisations without dedicated facilities personnel. The U.S. Department of Energy overview of energy management information systems describes capabilities such as utility-bill analysis, interval-meter analytics, fault detection and measurement and verification. Those functions support diagnosis; their presence does not itself establish that savings have occurred.
Rather than applying a generic percentage to every electricity bill, investigate five identifiable sources of avoidable consumption:
- Out-of-hours base load: ventilation, lighting or equipment running when premises are empty.
- HVAC overshoot: excessive heating, cooling or simultaneous heating and cooling caused by unsuitable controls.
- Standby consumption: appliances and electronics drawing electricity outside useful operating periods.
- Deferred maintenance: poorly maintained equipment requiring more energy to deliver the same service.
- Outdated equipment: inefficient assets retained despite a potentially favourable replacement payback.
The profit impact depends on the business’s cost structure. Consider a purely hypothetical company with annual electricity spending of 24,000 £ and annual operating profit of 40,000 £. Reducing electricity spending by 10%, with no offsetting costs, would save £2,400 annually, equivalent to 6% of its previous operating profit. This illustrates the leverage of energy savings, not a predicted result.
A low-cost screening test is to compare consumption during a normal working weekday with a comparable weekend day, using smart-meter or half-hourly data where available. Alternatively, inspect the site’s electricity demand around 3 a.m. when routine business activity has stopped. A persistent overnight load is a reason to investigate, not proof of waste: refrigeration, security systems and essential servers may need continuous power.
Record the observed load, operating conditions and any equipment suspected of contributing to it. A suitably qualified electrician can undertake circuit-level testing where safe access requires work near electrical conductors.
If no material avoidable load can be identified, an expensive managed service becomes harder to justify. If the initial test exposes a recurring problem, the next commercial decision is how to contract for a measurable result.
How to Choose an Energy Management Service Using a 12-Point Contract Checklist?
Choose an energy management service by making data access, baseline methodology, savings verification and provider accountability contractual obligations. The strongest agreement defines what the provider must do, how financial outcomes will be calculated and what happens if results disappoint. A persuasive demonstration or attractive subscription price is not a substitute for these protections.
A small business should evaluate a proposed contract against twelve requirements. The first five determine whether reported savings can be trusted; the remaining seven determine whether the service can deliver those savings at an acceptable cost and operational risk.
| Contract requirement | What to demand |
|---|---|
| 1. Data ownership | Confirm that the customer retains access to its consumption and analysis data. |
| 2. Data portability | Require exportable meter readings, reports and baseline models when the agreement ends. |
| 3. Baseline definition | Specify the reference period, included meters, operating conditions and exclusions. |
| 4. Savings attribution | Define weather and operational adjustments, rather than relying on raw year-on-year comparisons. |
| 5. Verification method | Agree how measured reductions translate into verified financial savings. |
| 6. Deliverables | Require named investigations, corrective recommendations and implementation responsibilities. |
| 7. Reporting cadence | Demand a periodic comparison of verified savings and total customer costs. |
| 8. Fees and expenses | Identify setup, subscription, equipment, maintenance and cancellation charges. |
| 9. Performance incentives | Explore payment tied partly to savings that satisfy the agreed verification rules. |
| 10. Exit rights | Define termination rights, notice periods and the handling of unused prepaid fees. |
| 11. Renewal terms | Identify automatic renewal, price changes and deadlines for opting out. |
| 12. Hardware independence | Clarify device ownership, compatibility and what remains usable after cancellation. |
Pay particular attention to savings attribution. A reduction in consumption after a warm winter is not necessarily caused by improved controls. Contract wording should require an agreed adjusted baseline and disclose any changes to the calculation method. Both parties should approve material baseline revisions before performance claims are accepted.
Useful provisions to look for include phrases such as “automatic renewal unless written notice is received”, “proprietary hardware required for continued service” and “software licence fees are non-refundable”. These terms are not inherently improper, but they can create financial commitments unrelated to realised savings.
A fixed-fee monitoring agreement creates another potential incentive mismatch: the provider receives its fee whether consumption falls or not. Ask for verifiable before-and-after examples and consider a fee structure in which part of the remuneration depends on independently checkable results. Any performance payment must also account for actions outside the provider’s control.
Before signing, request a sample monthly report and confirm that the supplier can reproduce its calculations using customer-accessible data. A provider unwilling to define the baseline or disclose how savings are calculated is unsuitable for a contract whose primary objective is financial payback.
Once contractual accountability is established, the remaining choice is whether an external provider is necessary at all. For a small office, that depends as much on available staff time as on software capability.
Which Is Better for a 20-Person Office: Managed Energy Service or DIY Software Dashboards?
For a 20-person office, DIY energy software is usually more suitable when the building is simple and someone can act on its findings. A managed service becomes more attractive when technical complexity, limited staff capacity or a short payback target requires outside accountability. Neither option guarantees savings: the deciding factor is whether identified problems lead to implemented changes.
A dashboard can provide detailed consumption information without changing operational behaviour. If the office manager already handles procurement, maintenance, staffing and supplier administration, energy alerts may remain unresolved. Conversely, paying a consultant to investigate a single obvious overnight load may cost more than the avoidable electricity.
The comparison should therefore include internal labour rather than treating a software subscription as the entire cost of DIY monitoring.
| Decision factor | DIY dashboard | Managed energy service |
|---|---|---|
| Upfront cost | Potentially lower if existing meter data is accessible; optional hardware adds expense. | May include onboarding, investigation or equipment costs. |
| Internal time | Staff interpret alerts, identify causes and coordinate corrections. | Provider handles agreed analytical tasks; staff still approve and facilitate changes. |
| Speed to first savings | Can be rapid for obvious problems with an available owner. | Can be rapid if mobilisation and corrective actions are contractually defined. |
| Technical expertise | Depends on the customer’s analytical and facilities skills. | Specialist expertise should be included within the agreed scope. |
| Accountability | Remains with the business. | Can be shared through measurable deliverables and performance terms. |
DIY is a reasonable starting point for a technically confident owner operating a single-meter office with accessible controls and predictable hours. Managed support may be more valuable for leased premises, complicated heating systems, multiple meters or sites where no employee can consistently investigate consumption patterns.
A third option avoids committing too early: collect one billing cycle of whole-site data, identify the largest unexplained loads and then invite managed-service providers to price specific interventions. One billing cycle may reveal operational waste, but it is generally insufficient to establish a reliable seasonal baseline.
This hybrid approach also improves negotiating leverage. Instead of purchasing generic monitoring, the business can ask a provider to diagnose a documented overnight load, correct operating schedules and verify the resulting reduction.
Hypothetical example: comparing the cost of action
A 20-person office estimates that its DIY monitoring arrangement costs £30 per month and requires four staff hours monthly. If those hours are valued internally at £25 each, the illustrative monthly resource cost is £130. A hypothetical managed service priced at £180 per month would cost £50 more before any additional equipment or implementation expense.
The managed option would need to justify that difference through saved staff time, better interventions or additional verified energy reductions. These figures are illustrative assumptions, not market quotations or evidence of typical SME savings.
The practical selection rule is straightforward: choose the least expensive approach that reliably converts findings into corrective actions. A dashboard is not cheap if nobody uses it, and a managed contract is not valuable merely because it produces sophisticated reports.
Whichever model is chosen, its reports must distinguish real financial benefit from apparent improvements in consumption charts. That distinction is essential to any credible 90-day payback claim.
The Reporting Trap That Makes Energy Management Look Successful With £0 Saved
Energy management can appear successful while delivering £0 in verified financial savings when reports highlight lower consumption without establishing why it fell or whether the reduction improved the customer’s costs. A mild winter, reduced occupancy or temporary closure can all produce impressive charts. Financial success requires an adjusted baseline and evidence that the benefit exceeds the costs of achieving it.
Consider an office whose electricity consumption falls during a month with fewer employees on site. A dashboard might celebrate a percentage reduction against the previous month. Yet if heating use declined because of warmer weather, or the business paid higher standing charges or unit rates, the reported energy reduction may not represent an efficiency gain or a lower invoice.
Two questions expose weak performance reporting:
- Savings compared with what, and adjusted for what? The report should identify the baseline and explain adjustments for weather, occupancy, working hours and other material conditions.
- Has the reduction reached the invoice or only the dashboard? Verified energy reductions should be reconciled with actual tariffs, billing data and payment obligations.
These questions distinguish physical savings from financial savings. Avoided kilowatt-hours can have a legitimate financial value even if tariff increases prevent the total bill from falling. However, that value must be calculated transparently using an agreed tariff basis, while actual billed expenditure should be shown separately.
The central payback calculation is:
Net verified benefit = attributable avoided energy cost − cumulative service fees − implementation and equipment costs.
For a hypothetical 90-day engagement costing £900 in total, with £600 of verified avoided energy cost over the same period, the net financial benefit would be −£300. The service would not yet have paid for itself, regardless of the percentage reduction displayed in its dashboard.
Weekly charts are useful for diagnosing faults but can obscure cumulative financial performance. A stronger report includes a simple two-line statement:
- Cumulative verified avoided energy cost: calculated against the agreed adjusted baseline.
- Cumulative customer costs: all provider fees and attributable implementation expenses paid or committed during the assessment.
Supporting notes should disclose the method, baseline changes, tariffs and material exclusions. If the first line exceeds the second, the service has reached cumulative simple payback for the measurement period. If not, the business should assess whether the remaining opportunity justifies continuing.
A transparent report can still be misleading if its reference period is unrepresentative. Establishing the baseline correctly is therefore the next essential step.
When Should You Start Energy Management So Your Baseline Data Isn’t Ruined by Seasonality?
Start collecting energy data as early as possible, ideally with access to a full year of historical consumption and corresponding weather information. If that is unavailable, capture the season driving the site’s largest energy demand before making strong annual savings claims. Monitoring can begin immediately, but a short, unrepresentative baseline should not become the unquestioned reference for performance payments.
A four-to-six-week baseline may coincide with unusually mild weather, school holidays, reduced production or a temporary building closure. Comparing subsequent energy use against that snapshot can either exaggerate improvement or conceal genuine savings.
For a heating-led office, winter consumption is especially informative. For premises dominated by air conditioning, summer performance matters more. Businesses with seasonal manufacturing or trading patterns also need operational records that explain fluctuations unrelated to efficiency.
Waiting through a full season is not always practical, particularly when energy costs are causing immediate financial pressure. An alternative is to construct the baseline from twelve months of existing bills, interval data where available, local weather records and documented operating changes. This establishes a broader reference without postponing every intervention.
The Department of Energy guidance on accessing utility data explains how systematic access to utility records supports benchmarking and investigation of unusual energy consumption. Historical comparisons become more informative when the business can connect consumption to operating conditions.
Before contracting, agree which circumstances would justify revising the baseline. A significant change in floor area, working hours, occupancy or production may require an adjustment. The provider should document those changes rather than replacing an unfavourable baseline retrospectively.
Five actions to establish an auditable baseline before signing
- Collect twelve months of utility records. Deliverable: a dated consumption and expenditure table identifying missing periods.
- Document operating conditions. Deliverable: a record of opening hours, occupancy, closures and major equipment changes.
- Identify weather-sensitive demand. Deliverable: a note specifying whether heating, cooling or another load dominates consumption.
- Agree the comparison method. Deliverable: a written baseline specification covering weather adjustments, tariffs and material operational changes.
- Define the financial review. Deliverable: an approved template comparing cumulative verified savings with cumulative customer costs at the 90-day checkpoint.
These actions do not require delaying urgent low-cost improvements. They establish the records needed to distinguish immediate reductions from longer-term performance claims.
Once the baseline is credible, a small business can begin testing efficiency improvements with existing utility records and limited additional metering rather than purchasing a comprehensive sensor network.
How to Measure Building Efficiency Gains Using Weather Normalisation and 2 Simple Meters?
Building efficiency gains can often be assessed using a whole-site electricity meter, a sub-meter on the largest controllable load and a weather-adjusted baseline. The method compares actual post-improvement consumption with the energy the building would have been expected to use under comparable conditions. It offers useful evidence without extensive instrumentation, although two meters cannot isolate every source of change.
The whole-site meter establishes the building’s total consumption. It may be an existing utility meter or an interval-data feed. The second meter focuses on a major energy-consuming system, such as HVAC, a plant room or another significant load. This division helps determine whether changes in the largest monitored system are consistent with changes across the whole premises.
Weather normalisation is particularly important when heating or cooling accounts for substantial demand. Heating degree days describe how far and for how long outdoor temperatures fall below a reference temperature; cooling degree days similarly represent conditions above a reference temperature.
A basic statistical model relates historical energy consumption to the relevant degree-day measures. Where the data supports it, the model can then estimate expected consumption under the weather experienced after the efficiency measures were introduced.
For a simple electricity model, the conceptual relationship is:
Expected consumption = base consumption + heating sensitivity × heating degree days + cooling sensitivity × cooling degree days.
Business activity, occupancy or working hours may need additional variables where they materially affect energy demand. A model should not be treated as credible simply because it produces a numerical answer: it must reasonably explain historical consumption and remain appropriate after the changes.
Use the following verification sequence:
- Establish the pre-improvement relationship between energy consumption, weather and relevant operating conditions.
- Record the efficiency measures, implementation dates and any simultaneous operational changes.
- Collect post-improvement whole-site and sub-meter data.
- Calculate expected consumption for the post-improvement conditions using the agreed baseline model.
- Compare expected and actual consumption, investigate unexplained differences and value supported reductions using the agreed tariff assumptions.
The DOE measurement and verification guidelines for energy projects describe the use of baseline and performance-period models adjusted for relevant conditions. The guidance also recognises interactions between efficiency measures, which complicate attempts to assign each intervention an independent saving.
A two-meter approach can support a useful building-level assessment, but it cannot fully distinguish equipment improvements from every behavioural or circuit-level change. Short observation periods and poorly fitting statistical models may also produce uncertain results.
Where reported savings affect grants, contractual payments, landlord disputes or formal environmental claims, select a verification method proportionate to the required confidence and consider independent technical review. Electrical sub-meter installation should be performed by appropriately qualified personnel.
The same hierarchy of measurement can be scaled down for a household, where whole-home visibility is useful but the cost and effort of monitoring must remain proportionate to the likely benefit.
Which Should You Choose: Clamp Monitor, Smart Plugs, or Smart Meter Data for a Busy Household?
For a busy household, start with available smart-meter data to understand whole-home consumption and its timing, then use smart plugs or targeted circuit monitoring to investigate specific loads. Smart plugs suit individual compatible appliances, while clamp monitors can measure electrical circuits when installed correctly. The best choice depends on the question being investigated and the time available to act on the readings.
More granular information is not automatically more valuable. Measuring every household appliance can become a substantial project without changing any decisions. A targeted approach identifies the most significant unexplained consumption first, then selects a suitable device to investigate it.
| Monitoring option | Best question answered | Main limitation |
|---|---|---|
| Smart-meter data | How much electricity does the whole home use, and when? | Data availability, resolution and access depend on the supplier, meter infrastructure and country. |
| Smart plugs with energy monitoring | How much electricity does this compatible plug-in appliance use? | Cannot measure hardwired appliances or circuits outside their rating. |
| Clamp monitor | How much electrical load is present on a monitored conductor or circuit? | Safe installation, correct conductor selection and device configuration are essential; some setups measure current without independently measuring power accurately. |
For households with limited time, three steps are generally more practical than an exhaustive appliance audit. First, inspect the whole-home consumption profile for unexplained overnight or daytime demand. Next, identify three to five plausible contributors, such as electric heating, refrigeration, clothes drying or always-on electronics. Finally, measure only the loads that could materially change a purchasing or operational decision.
Smart plugs should be selected for their electrical ratings and compatibility with the appliance. High-power, hardwired or otherwise unsuitable equipment should not be connected through an ordinary plug-in monitor. Clamp monitoring near a consumer unit should be handled by a qualified electrician where installation involves access to electrical wiring.
The household equivalent of an SME energy-management contract is a simple purchasing decision: does monitoring reveal enough actionable consumption to justify its cost? A household generally does not need an ongoing consultant merely to observe its monthly energy profile.
The underlying measurement principle is nevertheless transferable. Start with total consumption, isolate a significant load, account for weather or changes in use, and compare results after an intervention. That sequence is more useful than accumulating disconnected readings from multiple devices.
Household monitoring demonstrates the value of proportionate evidence. For a commercial building, the same principle can support a defensible record of efficiency improvements without requiring expensive permanent instrumentation.
Key takeaways before verifying building improvements
- Preserve evidence before the work begins: retain historical consumption, occupancy records and operating schedules.
- Separate efficiency from external conditions: normalise relevant weather effects and document changes in building use.
- Match confidence to the decision: basic meter data may support internal investment reviews, while disputed or contractual claims may require more rigorous verification.
How Can You Prove Your Building’s Efficiency Improved After Works Without Expensive Sensors?
You can often demonstrate improved building efficiency using historical utility bills, weather records and evidence of how the premises were operated before and after the work. Compare measured consumption with a baseline adjusted for relevant conditions, then document the resulting difference and its uncertainty. This can support a credible whole-building assessment without expensive sensors, but it does not necessarily prove which individual measure caused the improvement.
The central requirement is an evidence trail that a third party can follow. Collect twelve months of utility bills before the work and, when a complete annual comparison is required, twelve months after it. Preserve meter identifiers, billing dates, consumption units and any available interval readings.
Pair those records with local heating and cooling degree days for the same periods, where weather affects the relevant energy use. Add operating schedules, occupancy information and documentation of important changes such as extended opening hours, new equipment or altered floor area.
For an early 90-day review, only the post-intervention data collected to that point can be assessed. A quarter may be enough to evaluate an identifiable operational improvement, particularly where interval data is available, but it cannot automatically establish the annual outcome of a seasonal measure.
Next, separate consumption performance from invoice prices. Electricity costs can change because of tariffs, standing charges or contractual terms even when physical consumption is stable. Report adjusted energy consumption in kilowatt-hours alongside financial savings valued using clearly documented rates.
The evidence pack should contain:
- Pre-improvement bills or meter readings and a defined baseline period.
- Post-improvement readings and an explanation of any missing observations.
- Relevant weather data and the adjustment method used.
- Records of occupancy, operating hours and major building changes.
- A dated description of the efficiency works and available commissioning records.
- A calculation showing expected consumption, measured consumption, estimated savings and associated limitations.
For example, if a building’s adjusted model predicts greater electricity consumption than was actually measured after control changes, the difference may support an aggregate savings estimate. It does not by itself establish that the controls caused the entire reduction: other simultaneous changes must be investigated and disclosed.
This distinction matters when evidence will be used outside routine internal decision-making. A building owner considering future investment may accept a transparent, appropriately qualified estimate. A funder, auditor or contractual counterparty may require stronger isolation of the intervention, additional measurements or an independently agreed verification protocol.
Weather normalisation can strengthen comparisons, but it cannot eliminate every uncertainty. Where operating conditions differ substantially from the baseline, the measurement method must be revised or the claim limited accordingly. A credible report states what the evidence supports rather than presenting every observed reduction as a guaranteed consequence of the work.
Finally, return to the commercial question. An SME should calculate cumulative verified avoided energy cost and compare it with the full cost of the improvement and management service. Savings that cover a monitoring subscription but not its installation or implementation expenses do not establish full project payback.
At the 90-day checkpoint, request the adjusted consumption comparison, evidence of corrective actions, an itemised cost statement and a clearly supported payback calculation. Continue the service if the verified results and remaining opportunities justify the commitment; renegotiate or exit if they do not. The objective is not to purchase more energy data, but to make a financially sound decision from evidence the business can inspect.
Can energy management services really pay for themselves in 90 days?
Yes, it is possible when promptly implemented, low-cost changes deliver verified avoided energy costs greater than the full service and implementation expenses within that period. However, the available technical guidance does not establish a universal 90-day payback rate. The result depends on starting consumption, controllable waste, intervention costs and the speed of implementation.
What is the difference between a 90-day ROI review and a 90-day payback?
A 90-day ROI review evaluates financial performance and the evidence available after one quarter. A 90-day payback means cumulative attributable financial savings have covered all relevant initial and recurring costs by that point. A service can provide useful early findings without having achieved full payback.
Should a small business include standing charges when calculating energy savings?
Standing charges should appear in the reconciliation of total billed expenditure. However, charges that remain unchanged when consumption falls should not be counted as avoided costs. Only charges demonstrably reduced or eliminated by the intervention should contribute to the verified financial saving.
Are energy management services worthwhile for businesses renting their premises?
They may be worthwhile if the tenant can access reliable energy data, influence the equipment or operating schedules causing unnecessary consumption and retain an appropriate share of the financial benefit. Where energy is billed through a landlord, clarify data access, permissions and savings allocation before committing to a service.
What should happen if a provider cannot verify promised savings?
The customer should request the baseline calculations, adjustment records, consumption data and invoice reconciliation, then compare the evidence with the agreed contract requirements. If savings remain unsupported, contractual review, remediation or termination options should guide the next action. An unverified dashboard estimate should not be treated as an achieved financial return.